

It is not the strongest or the most intelligent who will survive but those who can best manage change.
– Charles Darwin
Month of February did manage to show the consistent trait of financial markets – CHANGE – as it saw various asset classes moving without a correlation and no single theme running through them. Policy outlook uncertainty ruled the sentiment as last mile journey towards inflation goal was proving tough. Highest volatility was seen in cryptos while it was the least in the currencies. But some direction seemed to be emerging towards the end of the month, though bigger breakouts were not visible in the currencies.
The major themes that guided the markets were-
- Divergence between market expectation on rate cuts and FED statements on the same narrowed down
- Stickier inflation numbers confirmed by CPI, PPI and PCE data in the U.S. In Europe, they were mixed across countries
- Stocks continued to make new highs in various regions. Nikkei made a new all-time high after 35 years surpassing 40000 marks
- New age tech stocks, AI companies led the rally in US markets, while investors in other markets followed US cues
- Economic picture in the U.S. remained strong on employment, but was on the slowing side in manufacturing and forward-looking indicators
- Europe showed more stabilizing picture which encouraged investors to diversity more into European assets. UK Pound remained attractive due to its highest policy rate after U.S.
- China markets were on the other extreme, dropping to lows seen during the Covid time. Government measures of cutting policy did not result in sustainable rallies leaving more expectations for structural reforms unfulfilled. Policymakers were intervening in stock and currency markets continuously.
- Emerging markets were less exuberant having rallied hard for several months, but India stood out with robust data on GDP, manufacturing and inflation slowly inching down. Equities continued to make new highs regularly.
- Crypto market saw record rally, with Bitcoin gaining nearly 62% in the last one month. The fresh rally was aided by the new ETFs launched in the U.S. with huge demand from small investors and big alike.
- Gold was the other asset class to rally 8% in one month as investors diversified marginally from equities and bonds and on conviction that rates had peaked across economies, though uncertainty about timing of cuts remained.
- February marked the third straight month of no hikes from G10 central banks – the longest such streak since summer 2021. Central Banks of Australia, New Zealand, UK, Sweden and India met during the month of February but decided to leave policy rates unchanged.
KEY ECONOMIC DATA FOR MAJOR COUNTRIES
During the month mixed data has been observed from U.S. but quite some numbers from Europe improving. UK was steady but China continued to struggle, still awaiting big policy moves from the Government.
U.S. employment data surprised to the upside with Non-Farm Payrolls rising by 353000 during January vs. market forecast of 180000, but the household survey actually indicated employment dropping. Also rise in jobs was due to more part-time jobs being created. Another indicator of weakness was average weekly hours worked that came at 34.1 vs. 34.3 which means more people were employed by reducing the working hours in general.
Leading Economic Index – It was the 23rd straight monthly decline, just one month short of the record-long slump that began in April 2007 and ran through March 2009 during the global financial crisis. The LEI is a forward looking indicator which gives a sense that in the months ahead the economy may be slowing.
Manufacturing PMI in the U.S. economy fell from 49.1 to 47.8 and it was the 16th straight month the PMI remained below 50, which indicates contraction in manufacturing. The ISM Services PMI for February dipped a bit to 52.6 vs. 53.0 forecast and 53.4 in January. Employment fell dropping back into contraction to 48.0 from 50.5 in January, which was the second lowest since Q3 2020. Factory orders in the U.S. in January saw the biggest contraction since April 2020.
| U.S.A | EUROPE | U.K. | JAPAN | CHINA | INDIA | |
| Particulars | current vs. prev | current vs. previous | current vs. prev. | current vs. prev. | current vs. prev. | current vs. prev. |
| GDP QOQ | 3.2 VS. 3.3% | 0% vs. -0.1% | *-0.3% vs. -0.1 | *-0.1 vs. -0.8 | 1.0 vs. 1.3% | 8.4 vs. 8.1% |
| Ind. Prod YOY | 0 vs. 1.2% | 1.2% vs. -5.4% | 0.6% vs. 0.1% | *-1% vs. -1.4% | 6.8% vs. 6.6 | 3.8 vs. 2.4% |
| PMI MFG | 52.2 vs. 50.7 | 46.6 vs. 4.4. | 47.3 vs. 46.2 | 48 vs. 47.9 | 49.1 vs. 49.2 | 56.9 vs. 56.5 |
| PMI SERV | 52.9 vs. 51.4 | 50.2 vs. 48.4 | 53.8 vs. 53.4 | 53.1 vs. 51.5 | 51.4 vs. 50.7 | 60.6 vs. 61.8 |
| Jobless Rate | 3.7 vs. 3.7 | 6.4 vs. 6.5 | 3.8% vs. 3.9% | 2.4 vs. 2.4 | 5% vs. 5% | 3.1% in 2023 |
| Inflation | ||||||
| Headline | 3.1% vs. 3.4% | 2.6 vs. 2.8 | 4% vs. 4% | 2.2 vs. 2.6 | *-0.8 vs. -0.3 | 5.1 vs. 5.69% |
| Core | 3.9% vs. 3.9% | 3.1 vs. 3.3 | 5.1 vs. 5.1% | 2% vs. 2.3% | 0.6 vs. 0.8 | 3.6% vs. 3.9% |
| Consumer Confidence | 106.7 vs. 110.9 | *-15.5 vs.-16.1 | *-22 vs. -24 | 39.1 vs. 38 | 87.6 vs. 87 | 92.2 vs. 92.2 |
| Leading Eco. Index | *-0.4% vs. -0.1% | *-0.8 vs. -0.7 | *-0.1 vs. -0.3 | 110.2 vs. 108.1 | *-0.1 vs. -0.3 | |
| POLICY RATE | 5.25-5.5% | 4.50% | 5.25% | -0.10% | 3.45% | 6.50% |
EUROPE: The current account surplus in the euro area grew to €32 billion ($34.5 billion) in December, up EUR 22 billion surplus in the previous month. In 2023, the current account balance posted a surplus of €260 billion or 1.8% of euro area GDP, shifting from a €82 billion deficit or 0.6% of euro area GDP in 2022. The strong performance on the Current Account is a big positive macro particularly when you compare it with the U.S. which runs around USD 200 bio deficit annually. This remains a big support for Euro Area macros remaining stable.
On the cyclical side, Eurozone’s key services sector picked up to a seven-month high in February, coming at 50.2 (yes, expansion) vs. 48.4 in January, while composite index also moved closer to expansion at 49.2.
CHINA: After China made a big move to stimulate the economy by cutting the Reserve Rate Requirement by 1% which released 1 trillion Yuan of additional liquidity to the system, they cut the 5-year loan facility rate by 0.25% (largest measure of cut) to boost the economic activity, but markets were disappointed as they looked longer term rate cut.
INDIA: The GDP number was a massive surprise to markets and analysts, coming at 8.4% vs. 6.6% expected. However, if you look at the GVA (Gross Value Added Product), the number at 6.5% was mildly moderating. This is because GDP included higher tax collection as well as cut in subsidies.
BOND MARKET: Bond market was again volatile during the month driven by alternate bouts of good and modest data from the U.S. and also influenced by frequent verbal intervention from Fed Speakers. Broadly, yields remained capped near the recent highs on market’s belief that FED will sooner or later cut rates, though exact timing still remains debatable.
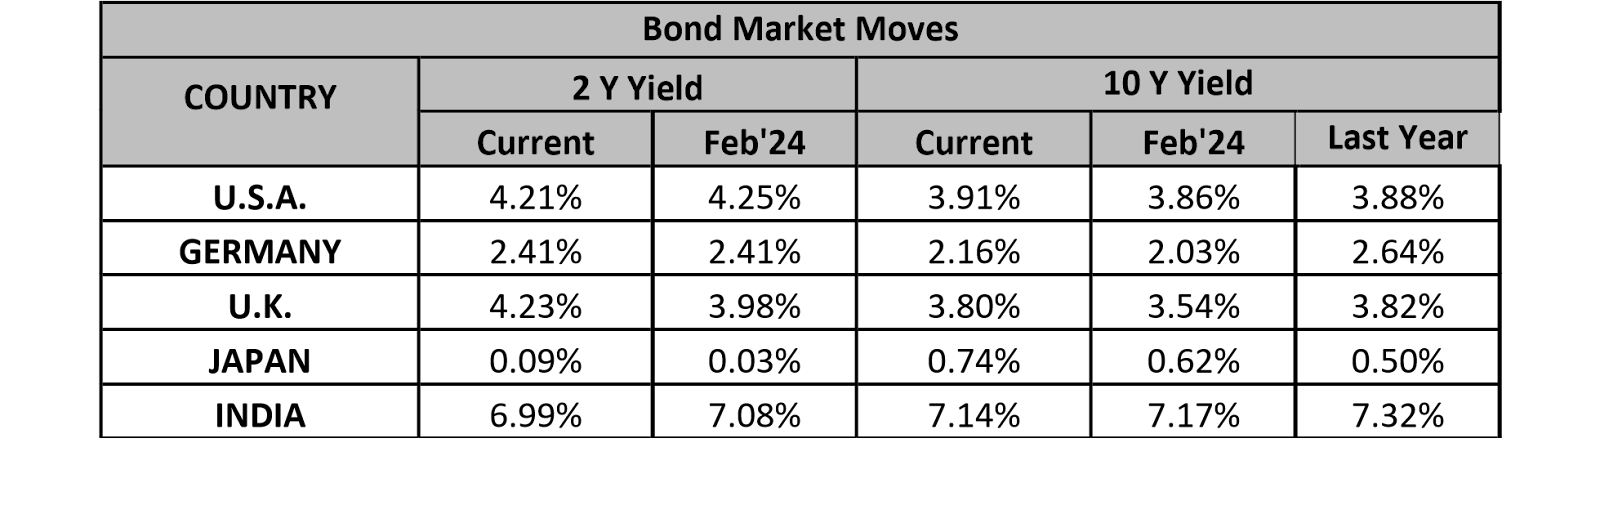
After the initial big move lower when budget was announced in February, yields in India have remained well supported above 7% for 10 year awaiting more clues on inflation and global rate moves.
Equity Markets
It was a record month for many markets across the globe in February as many of them hit alltime highs, mainly driven by liquidity. In U.S. the charge was led by big rise in AI related stocks after their numbers beat street estimates. European assets were in demand due to hopes of economy bouncing. Japanese Nikkei hit a new all-time high after 35 years (last seen in 1989 at 37887 and now new high at 40499).
| Indices | 29th Feb 2024 | 31st Jan 2024 | Abs Change | % Change |
| Dow Jones | 38,995 | 38,150 | 845 | 2.22 |
| S&P 500 | 5,096 | 4,848 | 248 | 5.12 |
| Nasdaq | 16,091 | 15,164 | 927 | 6.11 |
| German DAX | 18,678 | 16,903 | 1775 | 10.50 |
| UK FTSE | 7,630 | 7,630 | 0 | 0.00 |
| China Composite | 3,015 | 2,788 | 227 | 8.14 |
| Japan Nikkie | 39,166 | 36,286 | 2,880 | 7.94 |
| India Nifty 50 | 21,982 | 21,725 | 257 | 1.18 |
China continued to underperform others although it did show some bounce after rate cuts and moral suasion by the Chinese authorities asking their institutions to buy shares and also restrictions on selling. India had a rare underperformance during the month ending almost unchanged from previous month. Technically, it has formed a DOJI candle at the multi-year top and after rising almost 200% from its Covid Lows. Just for a comparison, it can be observed that the Chinese Market is still languishing near the Covid lows.
Stocks seem to be trading with very rich valuations in most markets and one can expect a sudden bout of corrective fall in the coming months, quite likely in March as one heads into quarter end repatriations.
Currency Markets
| Currency | 29th Feb 2024 | 31st Jan 2024 | Abs Change | % Change |
| USD Index | 104.16 | 103.27 | 0.89 | 0.85 |
| EURUSD | 1.0803 | 1.0816 | -0.0013 | -0.12 |
| GBPUSD | 1.2623 | 1.2685 | -0.0062 | -0.49 |
| USDJPY | 149.98 | 146.88 | 3.1 | 2.07 |
| USDCNH | 7.2065 | 7.1849 | 0.0216 | 0.3 |
| USDINR | 82.9 | 83.095 | -0.195 | -0.24 |
Currencies remained mostly rangy during the month awaiting stronger clues from the Central Bankers on rate moves. As US yields remained capped, Dollar carried slightly bearish bias except against the JPY which retested highs near 151. However, Japanese officials promptly came out with verbal warnings on excessive moves.
EURO was supported due to rising hopes of economy bouncing and also its strong current account surplus. Even a rate cut by ECB eventually has been discounted. In fact, in a survey, roughly one in five of the 75 central banks surveyed by the London-based OMFIF think-tank anticipate increasing euro holdings over the next two years, its recently published 2023 report showed. While 7% looked to decrease euro holdings, net demand was higher than for any other currency during the period and a jump from the 2021 and 2022 surveys of reserve managers controlling nearly $5 trillion (Reuters)
Recent Rupee moves have been in the same direction as DXY although the same is of much lesser magnitude. Flows have been strong for Indian Bonds and even restarted for equities after a lull period.
China Yuan still trades near the weaker end of its range despite Central Bank actions to support it as foreigners have taken a sober attitude towards investing in China until the next US elections, despite valuations looking very attractive.
Key themes/market drivers in India –
- Strong growth picture continuing as per the GDP data and PMI surveys
- Equity markets have been attracting fresh investments despite some expressing concerns on valuations.
- Bonds attracted large flows of over USD 5 bio in this calendar year.
- RBI is unlikely to cut rates until fourth quarter of this year thus keeping rupee yields attractive for inflows.
Outlook: Global
The emerging view of U.S. Exceptionalism to take a backseat as more and more data is coming on the slowing side. Eventually FED will cut rates as soon economy experiences recessionary tendency. The structural deficit of USA (Debt to GDP of 135%), fiscal deficit of 6.5% and trade/current account deficits make it vulnerable without foreign funding. Any monetisation of debt due to lower foreigner demand will weaken the Dollar substantially. Thus, both structural and cyclical factors are turning against the Dollar.
Expect Dollar Index to break 102.50 in the coming days/weeks setting up a retest of 100 psychological marks. Accordingly, EURO should move towards 1.12, JPY towards 145 and GBP towards 1.30.
Outlook: India
Looking at the various macro developments in the Indian economy, one would be tempted to call it INDIAN EXCEPTIONALISM. High growth, fiscal prudence, moderating external balances and strong flows from global investors puts India on a different plane which is already reflected in a super-strong performance of the equities.
Inclusion of Indian Bonds in major EM Bond indices was a big recognition of India’s place, but an upgrade by the global rating agencies may be due as well. Continue to expect a period of outperformance by the INR in the coming weeks/months as much of the good news is not in the current levels and as flows rise steadily, a stronger rally is on the cards.
Expect 82.40 to 83.10 ranges in the coming month, but will expand to downside after the current bout of up move in the Dollar Index ends. Financial Year end in March will add to flows and selling pressure. However, currency policy of the RBI will be a determinant of how far it can appreciate. It is believed they will be comfortable with modest appreciation when the Dollar Index drops to 100 or lower.
Technical Outlook
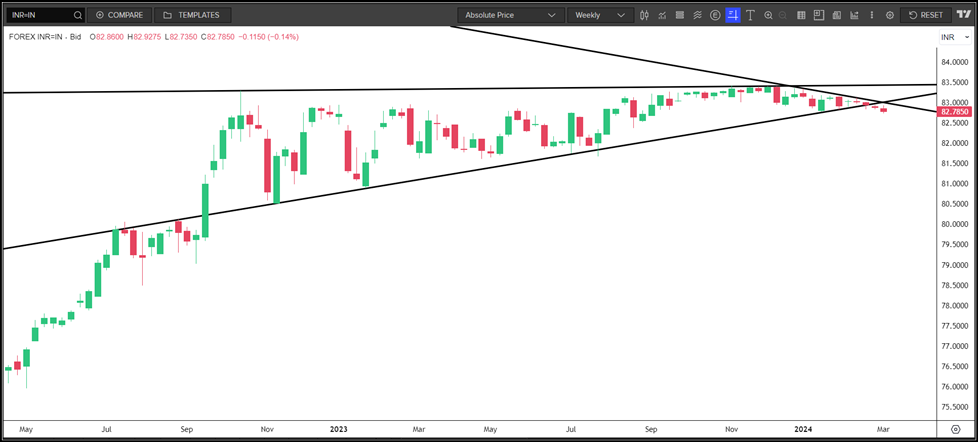
USDINR although continues to trade narrower but has shown interesting developments in its technical setup. The currency pair continues to experience a lower shift in its trading range slowly with resistances moving from 83.40 to 83.25, 83.15, 83.05 & recently 82.95. Weekly chart setup also shows convincing break of the months long supporting trendline in USDINR. Even the central bank influence is looking limited for the time being.
Considering this, we can expect the down move to further stretch towards 82.55/82.45 levels while the resistances continue to be at 82.95/83.10 levels initially. Further breakdown of these supports can lead the currency pair to 82.10 levels. Current technical setup looks slightly biased towards end of months long ranged action in the currency.
Commodity Outlook (Gold)
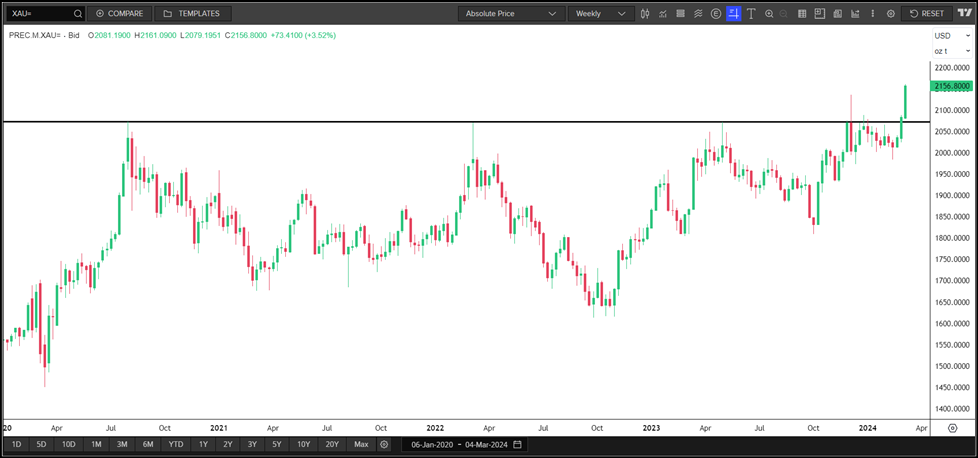
GOLD: COMEX: XAUUSD: CMP: USD 2156
Gold finally broke above the long-standing resistance zone of 2070 convincingly and continues to stay higher as against the previous break which saw retracement the same day. Bullish run in Gold to sustain with minor correction in place. Current support zone can be expected around the previous multiple tops observed i.e. USD 2070 (levels if seen should observe FOMO buying action by market participants).
Medium term target for Gold is around USD 2300 but immediate move towards these targets are less likely for the lack of triggers (although technically the chart setups are primed for a move upwards).
Price dips towards USD 2100/2080 to be capitalised for building long positions with stops around USD 2040 (below the yellow metal to get into ranged action again).
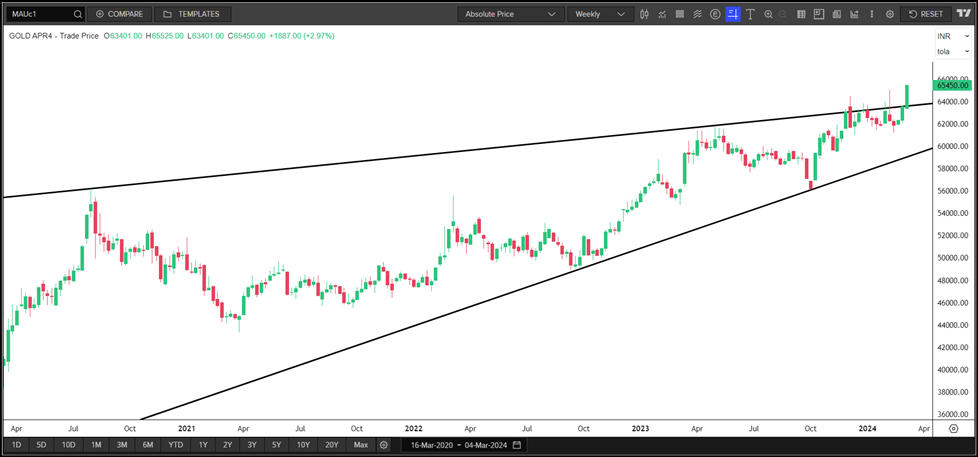
The yellow metal against INR on MCX made new highs in the past few days trading above INR 65000. The recent rally has been quite one sided with no meaning full correction in the past week, thereby opening chance for corrective actions towards INR 63900/64100 levels initially. Break of INR 63800(less likely) should lead to a move toward INR 63400. On the upside the targets continue to be above INR 67000/67500 levels in the medium-term time frame.
Prepared by:
Mr. Jayaram Krishnamurthy,
Co-Founder and COO – Almus Risk Consulting LLP
Mr. Shikhar Garg,
VP – Treasury Markets – Almus Risk Consulting LLP